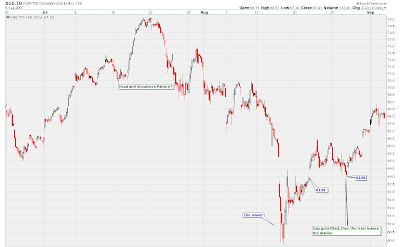
(you should hopefully be able to click on the image for a larger view)
What I find interesting is that the gap up was filled by only a 1 cent differential. This is because gaps tend to act as support and resistance. Once the gap was filled, it was all systems go for the gold bulls.
I have experienced this exact pattern before in October 2006 when I was trading Agnico Eagle Mines stock. The similarities between what happened above and what is shown below is uncanny:

Keep in mind that the above chart is a 60 minute chart again. This price action took place in the fall of 2006. Although not an island, please notice how the stock gaped up, filled the gap by a 1 cent differential, and then exploded higher. This is exactly what happened in the first chart posted.
If you find this analysis useful, then please tell your friends about this site. You can click on a little envelope below to email an article to other people. I cannot continue blogging unless more people visit this site.

![[Most Recent Quotes from www.kitco.com]](http://www.kitconet.com/images/live/s_gold.gif)
![[Most Recent Quotes from www.kitco.com]](http://www.kitconet.com/images/live/s_silv.gif)


1 comment:
Thanks for the comments, my friend. I will continue checking out your blog as well. I have added a link to your site on my links section.
Post a Comment