Sunday, March 30, 2008

Gold Update

Gold was able to reverse last week's downward momentum, and closed up about $16.00 for the week. Silver also retraced some of last week's severe pull back, gaining more than 6%. So, is the correction over, with new highs on the way, or is this round one of the correction?

Let's have a look at a weekly silver chart:


In the above chart, I am attempting to contrast the correction of May 2006, to the present. In May 2006, Silver was severely overbought, and we had one week of sharply lower prices. The following week, we had a bit of a recovery. Then, starting in the third week, the bears reemerged, and hit silver hard.

In the present, we had silver overbought, and had one week of sharply lower prices. This past week we saw a bit of a recovery. If this correction unfolds like the May 2006 correction, then we should see the bears reemerge in the coming weeks.

In my experience, gold and silver correct in three waves. One wave down, a counter-trend rally, and once final move down to clear out the weak hands.

Naturally, we'll have to keep an eye on the US Dollar to see what will be in store for precious metals. In last week's post, I mentioned that I thought that the US dollar was due for an oversold bounce. This turned out to be incorrect, as the bounce so far has been exceptionally feeble:


Nonetheless, the USD, at this point, has not put in a lower low. If the currency does put in a lower low, then gold and silver may not correct in three waves. My COT and intermarket analysis are giving mixed signals at this point, so I'm not really sure what's going to happen.

One lesson that I learned this week was that one should always have a glance at a chart of Crude Oil before making a bet on the direction of the Euro or USD. The following chart shows what I mean:


In the above chart, we have a candle chart of Crude Oil, and, on the bottom panel, we have a chart of the Euro. As you can observe, the two charts are highly correlated. What I find interesting is that Crude Oil bounced off support this week. Additionally, the Euro also experienced a bounce, but this bounce was not off any visible support. Interestingly, my view is that the Euro was bouncing off phantom support, which can only be seen by observing oil.

Bottom line is that I am expecting a three wave correction in gold and silver, but again, with the Euro looking strong, it's difficult to say what will happen. I think that I will remain hedged for this coming week until I feel more confident of a gold and silver bottom.

Friday, March 21, 2008

Gold and Silver Damage Assessment

For this past week, gold dropped $79.50, and silver lost an astonishing 18.42%. This post will attempt to analyze the extent of the damage, and try to determine what to expect next.

The first chart that I would like to log is a daily chart of GLD:

What you will observe in the above chart is that GLD failed exactly at the psychologically significant $100.00 area. The bears gained control of GLD at this level, and this was evidenced by the gravestone doji that formed on Monday in the the gold futures chart.

Afterwards, there was some very heavy selling that occurred on extremely heavy volume. This level of volume has never been seen before in this ETF.

Finally, on Thursday, GLD gapped below the dashed line, which is the 50 day moving average, and closed on Thursday near the lows of the session. Unfortunately, there is nothing bullish about this series of events.

The next chart is a chart of GLD, but this time we have a weekly perspective.

This week formed a very large red candle with no lower wick. In my view, this means that the bears are in complete control of this market for the time being. Furthermore, I find the magnitude of shares trading hands this week significant.

I mentioned in the last post that I thought a capital preservation mentality was warranted at this time. To me, this means hedging existing long term positions against market volatility. One way that I was able to do this is by purchasing a gold bullion bear ETF. To read more about these ETFs, click here.

Essentially, if gold bullion drops by, say, 5%, then this ETF should rise by approximately 10%. I think these products are a great idea, as they allow investors to speculate on the direction of commodities without getting involved in futures trading, or allow investors to protect themselves in downward markets. (By the way, last week, another ETF was launched that follows grains. The ticker symbols are HAU.to and HAD.to)

The next chart is a weekly chart of SLV.

What I wanted to take note of is that SLV failed at the $200.00 level after being, what I would say, overheated. Again, we have a very bearish weekly candle, but at least we are in the proximity of some potential chart support.

Next I wanted to make note of a daily CandleVolume chart of SLV:

What I like about this this type of charting is the visual representation of volume. Larger candles mean higher volume, and we had some big ugly candles put in this week. I also found it interesting that SLV got blown out of its bollinger band on Friday. Unfortunately, again, I see nothing bullish about the above chart.

In the last post, I said that I had finally thought that the USD was looking oversold. This week, we had a bounce in this currency after putting in a bullish candle.

In addition, my intermarket analysis is indicating that there is more USD strength coming next week. However, I do not expect the USD to surpass the red resistance area pointed out below:

What I have noticed whenever gold has a correction, and there have been a few over the last 5 years, is that 'analysts' from Bloomberg or MSNBC come out and declare that the bull market is over, and the previous run up was nothing more than a bubble.

I guess since these guys were cheer leading the Nasdaq bubble, and were completely oblivious to the housing bubble, that we can expect them to be experts in this area.

In my view, gold is nowhere near what I would consider to be a bubble. Only about 1.5% of investment monies worldwide are in invested in gold or gold shares, and probably fewer than 1 tenth of 1 percent of North Americans own precious metals. Furthermore, if one were to take the market capitalization of all the gold stocks in the HUI index, it would still be less than the market capitalization of one company in the DOW Jones, such as Coca Cola.

Also, judging by the fact that nobody ever signs up for the free precious metals investing kit I advertise on my blog, the sentiment is just not lined up for what I would consider a bubble. When your neighbors start talking about the gold they just picked up, or if you hear your friends at work talking about how much money they made in the gold stocks they bought, then you know we are in trouble.

Another way I like to look at sentiment is through analyzing the number of hits popular gold sites, like Kitco, receive. Generally, when gold and silver start rising very quickly, the general public begins to get interested, and may begin to visit sites such as these.

Usually, by the time the public begins to get interested, the move is over, and the professionals start to unload their positions, and gold and silver come crashing down. Here is a chart the exemplifies this:

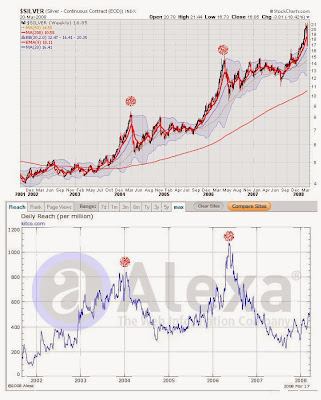
In the above chart, we have the price of silver, and in the bottom panel, we have the number of hits to Kitco.com. What I find interesting is that during this recent run up, the public never really got excited like they did in previous run ups, which I think further disproves the bubble theory.

Therefore, the bottom line, in my opinion, is that, while gold and silver are showing no signs of a bottom at this time, the long term bull market is still healthy, and I do not see this correction as being any different from the many other corrections that precious metals have faced before.

Sunday, March 16, 2008

A Critical Look at Gold and Silver

For this past week, gold rose by about $25.00 an ounce, closing on Friday at $999.50 after making a brief foray into quadruple digits. Silver, on the hand, failed to reach a new high, but was still up 42 cents for the week.

Let's get right into the charts by looking at a really long term view of the yellow metal. The following chart is a monthly chart of gold, and goes back to about 1990:


My goal in the above chart is to contrast this recent action against the last time gold went parabolic, which was during the spring of 2006. If you don't recall, gold went ballistic during February, March and April of 2006, and then came crashing down in May and June. In my opinion, gold appears equally over-extended now relative to then. To view a monthly chart of silver, please refer to the bottom of this article.

Gold is not the only story making the news right now. There are also some exciting developments in the foreign exchange markets. One such development is that 1 US Dollar buys less than 100 Yen presently, and that the Swiss Franc is practically at par with the US Dollar.

The next chart shows that the Swiss Franc and Gold are related. What the weekly chart below does is that it takes the RSI of the Swiss Franc and contrasts it to the price action of gold bullion:

In other words, the above chart is showing that whenever the Swiss Franc is overbought, it represents a dangerous time to hold gold.

And on the topic of currencies, let's have a look at a weekly chart of the US Dollar. The US Dollar Index, which is an index that measures the US Dollar against a basket of six other major currencies, hit another all time low again this week.

In my opinion, the US Dollar is now, at long last, finally starting to look oversold to me. On a fundamental note, I have a feeling that European Central Banks and the Bank of Japan will not just sit idly and watch their currencies rise week after week. Although a falling currency is bad for an economy, a rapidly rising currency also has economic ramifications, especially to an export oriented economy such as Japan.


Another angle to look at the precious metals market is through the silver gold ratio. Silver and gold are certainly correlated, but they do not always move together on a one to one ratio. By dividing the two metals, one can determine which is outperforming:


In the above weekly chart, we have the RSI of the Gold/Silver ratio, and a chart of the HUI Gold Bugs Index. My rationale behind this chart is that when precious metals start to take off, silver usually begins to outperform gold. Silver is a more speculative market, with large swings, and so when the precious metals market heats up, money piles into silver. This speculative buying into silver eventually climaxes, and then comes crashing down, bringing gold stocks down with it.

Another point I wanted to touch on is the significance of gold being right under $1,000. This could possibly be a formidable resistance area. It took oil 4 attempts to break through the psychologically important $100 area. It took the Dow Jones Industrial Average 20 years to get past the 1,000 area.

Although my analysis shows that gold could be in short term trouble, keep in mind that I do not recommend shorting gold or gold stocks. There are a lot of variables that I do not know the outcome to. For example, will the Fed's cut next week throw the US Dollar near the point of collapse? What if another major US Bank melts down? These are very uncertain times, and I think a capital preservation mentality is warranted at this time.

The fundamentals for gold, silver, gold stocks, and oil are very strong right now. The best bet is to try to accumulate a long term position in these areas, and dollar cost average when there are dips.


This weekend, I enjoyed the posts from:

HeadLineCharts

Sunday, March 9, 2008

More Charts

Last week saw Crude Oil and the Euro hitting new all time highs, and the US Dollar Index hitting a new all time low. At the same time, gold was flat for the week, closing on Friday at the same point it opened at on Monday.

The first chart that I'd like to keep in this blog for my records is a weekly chart of silver. Silver has been white hot for the last few months, and I hope this following chart puts this current move into perspective:


The above chart shows 2 previous occasions where silver went parabolic. These occasions can be put into perspective by analyzing how far the price peeled away from the 50 week moving average. As you can observe, when silver is more than 30% higher than its 50 week moving average, the risks of holding silver are increased.

This indicator by itself is not a sell signal, as silver can still become hotter, which is what happened in May 2006. I do, however, see this as a caution flag. Furthermore, silver put in a bearish candle last week.

Another chart that caught my eye this weekend was a chart outlining Silver's commitment of trader structure. The last time I showed this chart was in this article. This time, I want to draw attention not to the commercials, but to the level of open interest:


In the chart above, open interest is represented by the line, and not by the bars. I have drawn circles when open interest bottomed, and where it has now peaked. In my interpretation, this is a potentially bearish development.

Bottom line for silver is that the trend is up, so shorting silver would still be unwise. However there were some cautionary flags raised this week in the charts, so one's focus should now be on capital preservation strategies, such as hedging.

This next chart is a weekly chart of platinum:


Platinum is another commodity that until recently was going parabolic. Last weeks price action may suggest that this party could be over. The bears seem to now be in control, as evidenced by last weeks candle. Furthermore, the RSI and ADX readings were nearly off the charts.

The next chart is a daily chart of the HUI Gold Bugs Index:


In my opinion the HUI is struggling to surpass the 500 area. Last week, the bulls and bears waged a back and forth battle, with the result being a draw at this time. Until a decisive victory is claimed, cash may be the best bet.

Saturday, March 1, 2008

Major Breakouts and Breakdowns

This past week was another satisfying one for commodity bulls and US Dollar bears. Gold rose another $27.00 an ounce to reach yet another all time high, silver experienced a blistering rally this week of 10.42%, and even the price of nickel was up about 14% between the span of 2 days.

At the same time, the US dollar melted down again, breaking through major support into what is now literally uncharted territory. Let's have a look first at the damage:


I cannot see any reason not to be short US dollars at this time. There is absolutely no support down below, and no telling when the free-fall will hit bottom. Referring to the RSI, which is a much less sensitive 21 day RSI, one can see that the Dollar is not oversold at this time as well.

Watching the US dollar fall apart last week in real time, and knowing that other short sellers like myself were swarming this currency, was very exciting. The amount of money that could be made in this market is amazing.

Anyway, a US Dollar defeat is always a Euro victory as shown in the following chart:


As you can observe from the above point and figure chart of the Euro ETF, FXE, a major quadruple top breakout occurred this week. This chart goes back to about September 2007 and has a 3 box reversal.

If you prefer to observe the Euro using a traditional candlestick chart, here is a weekly chart of the Euro index:


The main points are that the trend is up, so there is no sense in fighting that, and that the Euro has decisively cleared major round number resistance.

Another sector that also cleared an important milestone this week was crude oil. Over the past few months, black gold was struggling to break through the psychologically important $100.00 a barrel area. This struggle ended this week, with victory going to the bulls:


Over the past few weeks, I have been reading books, and watching documentaries that outline a bullish case for Crude Oil. Most of these books are on peak oil, and I am fully convinced that this theory is sound. I will not go into any details right now, but suffice it to say that the fundamentals and technicals are both extremely positive right now. Two ways to participate in this bull market are through USO or HOU.to.

Presently, oil looks more bullish to me than gold or silver. If you refer to a weekly chart of gold stocks, you will see that there was no bullish breakout from its trading range at this time. Also, gold will correct one of these days, as it is more overbought than oil. I have no idea when it will correct, and betting against gold would be unwise, but perhaps it will bounce down from $1,000 an ounce resistance.

So, bottom line is Dollar is bearish, Gold and Silver are neutral, and the Euro and Oil are bullish, in my opinion anyway. Thanks for visiting.