Thursday, July 31, 2008

The Wisdom of Peter Schiff

With the last video I posted on this site, I recommended a weekly webcast called the Financial Sense News Hour. One of the advantages of listening to this program is that one can become exposed to the ideas of many different guest speakers.

Peter Schiff is a regular contributor to this internet radio show, and is where I first came across his ideologies. Peter Schiff is a stock broker, money manager, author, and, in my opinion, an expert in his field.

About 1 year ago, I read Schiff's book, Crash Proof. In it, he explains his outlook on the US economy, the housing market, the US dollar, and gold. Looking back now at this book, I am amazed at the clarity of wisdom, and the accuracy of his predictions. Most interesting of all, so far only half of his predications have come to pass, with the other half still in the pipeline, in my view.

Here is a video of Peter Schiff shot in November 2006:

Sunday, July 27, 2008

Trading Gold Corp's Relative Strength

In the previous post, I mentioned the importance of managing risk by hedging. I also talked about how profitable traders tend to buy strength and short sell weakness. One way of following both principles is to buy a company that is showing strong relative strength, and short sell the index.

The following chart shows Gold Corp, symbol G.to, divided by an ETF that tracks the entire gold stocks sector, XGD.to:

The above chart shows how your profit and loss diagram would look like if you had bought shares of Gold Corp and short sold an equal dollar amount of XGD. With this type of strategy, you are not betting if the price of gold will rise or fall, since you could make money either way, so long as Gold Corp continues to outperform the index.

This type of strategy does not involve making forecasts or trying to predict what the future has in store. It only involves following the trend for as long as it lasts, and getting out when the trend ends.

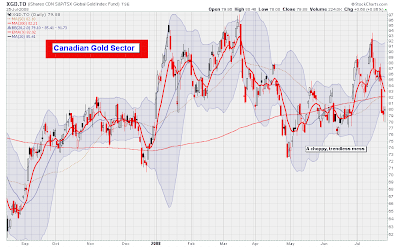
The next charts show XGD by itself. As you can see, it is very choppy, trendless, and difficult to trade at this time:

One difficulty that trend traders sometimes face is that they need to wait for long periods of time before a major trend develops. But by using ratios, hundreds of combinations can be created, and trends can be found.

By trend trading hedges, I feel that I significantly reduce the level of risk, and at the same time, extract money from the hedge by following the trend. Reducing risk is important, especially if you are dealing with Horizon ETFs, since these products are exceptionally volatile.

The chart below shows an ETF a have talked about a few times before, HNU.to. This ETF tracks the price of natural gas, and, as you can see, is one of the riskiest funds out there:


If you had made a $10,000 investment in this fund three weeks ago, it would have dipped to nearly $4,000 in a matter of days. This is why it is essential the manage risk, and cut losses short if the trend moves against you.

Saturday, July 19, 2008

Reducing Risk by Using Hedges

One trait common amongst all successful traders is the ability to manage risk. Experienced traders ask not how much money a trade can potentially make, but how much money a trade could potentially lose. Put another way, not losing money is more important than making money.

When I first started trading, I would usually bet all of my account on a single trade. I have learned (the hard way) that this is not a wise strategy. What I like to do now is go long and short different markets simultaneously in order to reduce risk.

As an example, for the past couple of weeks, I was long gold and short Canadian financials. I did this because the trend for gold was up, and the trend for financials was down. My plan was to hold on to these positions for as long as the trend persisted, which could end up being a day, or a year.

I got blown out of my financials short last Tuesday, but am still holding the gold position. Since I like to have a long and short position on at the same time, I decided to off set some of the risk in my gold position by shorting natural gas. I decided to short natural gas because the trend has turned down.

Being long one commodity and short another substantially reduces risk, but still allows for profit if one of the following three outcomes occur:

1) Gold and natural gas both fall, so long as natural gas falls faster
2) Gold and natural gas both rise, so long as gold rises faster
3) Gold rises and natural gas falls. This is the ideal scenario!

The following chart shows an ETF that tracks gold, GLD, divided by an ETF that tracks natural gas, UNG. If you are long gold and short natural gas, you want this chart to be rising:

As the above ratio chart shows, there are clear times when gold outperforms natural gas, and vice versa. Using this type of ratio charting can help you spot trends that are occurring beneath the surface, which I think allow for an opportunity to profit at a reduced level of risk.

For example, there are times where commodities will correct dramatically, and every commodity will be in the red. If we get one of these days, it probably will not negatively affect my account.

Again, the goal of this position is to remain long gold and short natural gas for as long as the trend persists. If the trend turns around, I will be out.

Wednesday, July 16, 2008

Interview with Oil Expert Matt Simmons

I feel that when someone works hard, does research, and makes a bold forecast that eventually comes to fruition several years later, that person should be given credit. Along with Richard Heinberg, who I mentioned last time, Matt Simmons is one such person.

Matt Simmons, who spent his entire career working with the oil industry, is author of Twilight in the Desert. Simmons also appears frequently in interviews, such as the one done by Bloomberg above, and was featured in the documentary Crude Awakening, which I highly recommend.

Every weekend I listen to a radio broadcast that can be downloaded from the internet called The Financial Sense News Hour. You can download for free the interviews done with Matt Simmons on this show by clicking here and here.

The Financial Sense News Hour piqued my interest as soon as I began listening to it over 3 years ago now. The program is about 4 hours every weekend, and can be downloaded to an iPod or MP3 player.


Sunday, July 13, 2008

Trend Following Using Renko Charts

Over the past year on this site, I have attempted to use technical analysis and intermarket analysis to help better understand the gold market. During this time I think I have made some fairly decent calls, but have also made mistakes along the way. One of the advantages of maintaining this blog is that I can go back and read old posts and see exactly what I was thinking. I can analyze what worked and what didn't.

One common theme of all my money losing trades is that they were made in the opposite of direction of the trend. Having learned from past mistakes and also from reading some excellent books along the way, namely from an author by the name of Michael Covel, I have formulated a series of rules that will prevent counter-trend trades from happening in the future.

The basic premise of trend following is that you want to be buying when prices are going up, and selling when prices are going down. This seems fairy logical, but, unfortunately, most amateur traders instinctively endeavor to do the opposite. Many beginners will stack up as many indicators on a chart as possible, and will start looking to buy as soon as one of them dips down past some arbitrary threshold to an oversold level.

Another common tactic amongst neophytes is to buy stocks making fresh 52 week lows. Like the previous tactic, this also results in buying stocks that are going down.

My trend following technique that I am now using uses Renko charts to help me avoid buying falling stocks. I used to maintain another blog called Trading With The Trend, and the technique there involved moving averages to define the trend. I still think that this is a valid method, but I discontinued this blog due to underwhelming demand.

Anyway, the advantage with Renko charts is that the only factor in their construction is price. They do not even factor the passage of time, which makes them distinct from moving averages. Moving averages can suffer from whipsaws in a sideways moving market, but Renko charts only react to changes in price and not time. If there is no price movement, then Renko charts will remain static. They are, in a sense, a Japanese version of Point and Figure charting.

Here is a chart of GLD over the past year and the signals that would have been generated:


The areas highlighted in yellow are the areas you would be long. The areas not highlighted you would not be in the market. You would not be permitted to short gold during this time. I am not willing to go through all the rules in detail for this technique, but here are the main criteria for any trend following technique:

1) Buy strength
2) Short sell weakness
3) Take small losses
4) Let winners run
5) Manage risk

Wednesday, July 9, 2008

Commitment of Traders Analysis of Crude Oil

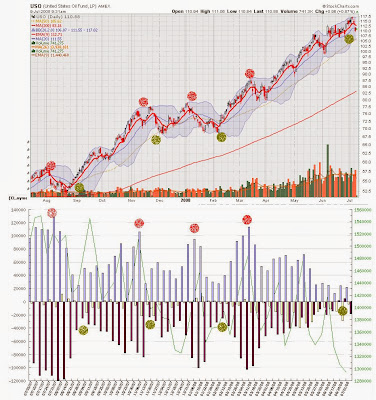
The chart below shows a chart of an ETF that follows the price of crude oil, which has the ticker USO, on the top panel, and a chart breaking down oils COT structure on the bottom panel:


I explained the way I interpret this type of chart in this post. In a nutshell, you want to be buying when the commercials have a small short position, and you want to be selling when the large speculators are large long position. In the bottom panel, the commercials are in purple, and the large speculators are in blue.

If you click on the above image, and match up green circles on the bottom panel, with the green circles on the top panel, you will see that these are times where the commercials had reduced their short positions, and therefore a buy signal was generated. The opposite is true for the red circles.

Right now, the commercials have not only reduced their short position, but they were long for a couple of weeks, which is something I have not seen before. Commercial traders are generally those that physically use the commodity, and have access to more information that the public would have access to, so it makes sense to buy when they are buying.

I still feel that going long commodities and shorting equities is a prudent strategy based on the way my charts look right now.

The Party's Over by Richard Heinberg ---video

Richard Heinberg is the author of The Party's Over, Power Down, and Peak Everything. I highly recommend all three books, but I would recommend reading the author's first book to start, as it goes over the theory of peak oil on a general level, whereas his other books are more specific and philosophical in nature.

Personally, reading these books awakened me to a whole new way of thinking, and had a profound effect on my long-term investment decisions. The information detailed in these books I think provide another pillar of support for the iron-clad bullish case for gold and silver, although this is not the author's intentions.

Please enjoy the above YouTube video.

Sunday, July 6, 2008

Horizon ETF Math

As I have mentioned before on this site, Horizon ETFs are a type of investment that allow traders to go long or short a particular market with 200% daily exposure. For example, this organization has two ETFs that track natural gas:

HNU-which stands for Horizon Natural gas Up
HND-which stands for Horizon Natural gas Down

This means that if in a given day, the price of natural gas rises by, say, 2%, then HNU should rise by about 4%, and HND should fall by about 4%.

Both of these ETFs were launched in mid-January 2008, with a price of $20.00 per share. What I was curious in finding out is what if you had purchased both of these ETF right from the start and held them to today. At first I thought that purchasing equal amounts of both ETFs would create a perfect hedge, with the gain of one fund offsetting the other. However, this was not the case.

Below is a chart showing HNU on the top panel, and HND on the bottom panel going back until the date these funds were launched:
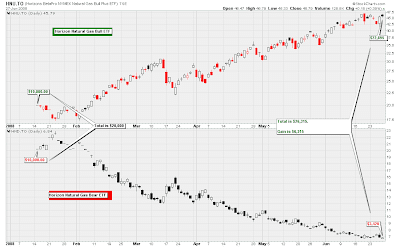

If you click on the above image and read the annotations, you will see that if you had invested $10,000 into each fund on inception date, you would actually have produced a nice profit. The two funds, in other words, did not cancel each other out.

The reason for this is that as the price of natural gas rose, the balance of HNU was growing larger, and the balance of HND was becoming smaller. As this trend continued, the percentage change had a larger dollar value to work on with HNU and a smaller balance to work on with HND.

Put another way, the bull ETF has unlimited compounding potential upwards, but the bear ETF cannot reach zero, and its chart becomes what is know as asymptotic as it approaches the X axis of the chart.

Believe it or not, knowing this can be useful in the real world. Let's say you have $10,000 worth of energy stocks in your portfolio, and you feel that perhaps now you want to take out some insurance against a potential market correction. To do this you would buy $5,000 worth of HED, which will rise 2% for every 1% the Canadian energy sector falls.

At this moment your $10,000 position is hedged. But if energy stocks continue to rise, your insurance in HED will start eroding, which will mean that to remain hedged you will need to buy increasing amounts of HED to maintain the hedge. Conversely, if a correction in energy does in fact materialize, then you would become over hedged if you do not trim back your exposure to HED as the correction continues.

I still think these ETFs are an innovative product, and, luckily, a new set of these type of ETFs have just been released:

•S&P 500 Bull Plus ETF
•S&P 500 Bear Plus ETF
•NASDAQ-100 Bull Plus ETF
•NASDAQ-100 Bear Plus ETF
MSCI Emerging Markets Bull Plus ETF
MSCI Emerging Markets Bear Plus ETF
•U.S. Dollar Bull Plus ETF
•U.S. Dollar Bear Plus ETF
•U.S. 30-year Bond Bull Plus ETF
•U.S. 30-year Bond Bear Plus ETF