The first chart that caught my eye this week was a weekly chart of the XAU. Prior to this week, the stocks were underperforming bullion, but that may change:

My view is that gold stocks are recharging after the blistering rally that occurred in the fall. This consolidation is taking the form of a triangle, which should break out to the upside. The indicator at the bottom of the chart shows that the XAU is now trading closer to its 50 week moving average, which, in my opinion, shows that some of the overbought condition has been worked off, and gold stocks bulls have reloaded for another assault higher.
Another chart that is similar to the one above is a weekly chart of the Euro:

The main point here is that the Euro, like gold, is in a very strong uptrend. I've learned through experience that fighting trends is a losing game, usually even if there are indications of trend reversals. Luckily, in this case, the trend is up, and there are no signs, such as a bearish candle or overbought reading, that trend will reverse.
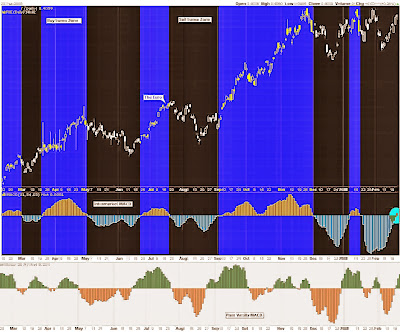
Trading with the trend is vitally important, but there are other tools one can use to assess the strength of a trend. One tool is using Commitment of Trader data, which I already showed in another post, so I won't show it again. Another is through intermarket analysis. The chart below uses intermarket analysis, and is a variation of a chart that I have attempted to explain here.

The MACD Histogram that is in black is derived from a ratio, and is independent from the Euro's price action. The MACD in white is a traditional MACD using data from the Euro's price action.
What I like about the first MACD is that you are not using price A to forecast movements in price A. For this reason, the first MACD has the potential to be a leading indicator, unlike a traditional MACD, which always will be a lagging indicator.
The leading MACD has just entered the Euro buy zone.
As you could probably guess by the creative title given to this post, I will now begin talking about a new ETF. This relatively new ETF follows the Rogers International Commodity Index, and the ticker symbol is RJA:

I mentioned earlier that trading in the direction of the trend is vitally important, which is why this ETF caught my eye. There are some really ugly black candles here, which are a result of investors placing market orders at or before the opening bell. The bottom half of this post explains why this is a bad idea.
What I really like about the above ETF is that you get a tremendous array of different commodities. Here is pie chart that show where your money would be put to work:

This ETF will give you exposure to areas that ordinary investors would likely otherwise never have access to. I know I am not prepared to invest in Lean Hogs or Lumber any other way. Soft commodities have been the top performing sector for this past year, even outperforming gold and silver, so having some exposure may be prudent.

![[Most Recent Quotes from www.kitco.com]](http://www.kitconet.com/images/live/s_gold.gif)
![[Most Recent Quotes from www.kitco.com]](http://www.kitconet.com/images/live/s_silv.gif)


3 comments:
Hi, another great article. I agree that the XAU looks like it wants to break out again.
I appreciate your compliment. Gold stocks still look good right now.
Oil also looks very strong, especially the commodity itself. Black gold has been clearing some major resistance this week.
Thank you for your posts and charts! I'm learning a lot.
Any chance to tell us, please, what ratio you are using? :-)
Mario
Post a Comment